Watch Statistical Analysis with Excel 2013 Advanced Skills
- TV-NR
- 2014
- 1 Season
Statistical Analysis with Excel 2013 Advanced Skills is a comprehensive learning resource from John Wiley & Sons, Inc. that aims to equip individuals with advanced skills in Excel 2013 for data analysis. The show is designed to cater to individuals who wish to gather, analyze, and interpret data for decision-making, forecasting, and prediction purposes.
The course is presented by Conrad Carlberg, Ph.D., who is a recognized expert in data analysis and Excel 2013. Conrad provides detailed explanations and demonstrations of various Excel features that are essential for conducting statistical analysis. The course is divided into several modules, each of which covers a different aspect of the Excel 2013 environment, such as data visualization, data summarization, regression analysis, and hypothesis testing.
One of the standout features of Statistical Analysis with Excel 2013 Advanced Skills is the emphasis placed on practical applications of statistical analysis. Conrad demonstrates how to apply statistical analysis techniques to real-world scenarios by using sample data sets, enabling viewers to see how the theory translates into practice. The course also provides examples of how statistical analysis can be used in various industries, including healthcare, finance, and marketing.
The first module of the course focuses on data visualization. Conrad explains how to use charts, tables, and graphics in Excel to present data effectively. He demonstrates how to create different types of charts and explains when to use each type. The module also provides tips on how to improve the visual appeal and clarity of charts and tables.
The second module covers data summarization. Conrad explains how to use Excel functions such as AVERAGE, MEDIAN, SUM, and COUNT to summarize data quickly. The module also covers pivot tables and pivot charts, which are powerful tools for summarizing large data sets.
The third module delves into regression analysis, which is a statistical method used to analyze the relationship between two or more variables. Conrad explains the theory behind regression analysis and demonstrates how to carry out regression analysis in Excel using the Regression toolpack. He also demonstrates how to interpret the results of regression analysis.
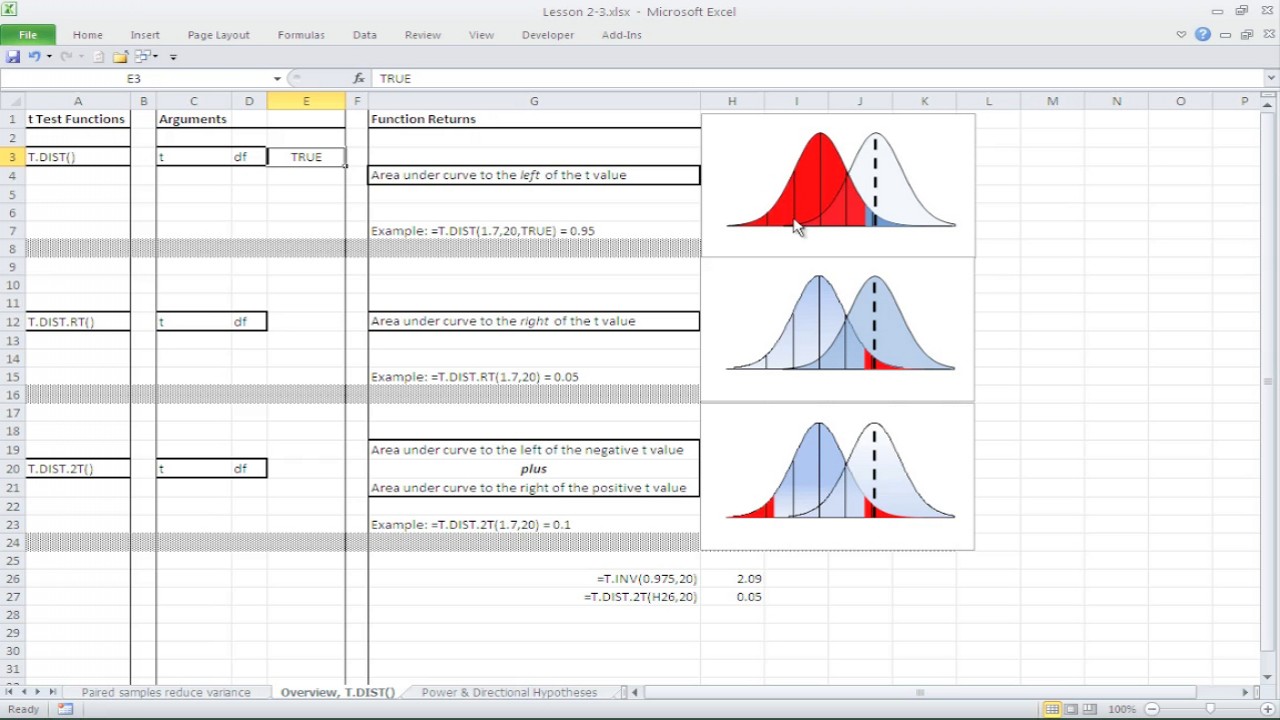
The fourth module of the course focuses on hypothesis testing, which is a statistical method used to determine whether a sample taken from a population is representative of the population. Conrad explains the theory behind hypothesis testing and demonstrates how to conduct hypothesis testing using Excel functions such as T.TEST and Z.TEST.
The final module covers special topics in statistical analysis. Conrad demonstrates how to perform advanced statistical analysis techniques, such as ANOVA, Nonparametric Tests, and Time Series analysis. He also provides tips on how to clean and validate data and how to deal with missing data.
Overall, Statistical Analysis with Excel 2013 Advanced Skills is an excellent resource for anyone who wishes to enhance their skills in statistical analysis. The course is well-structured, and Conrad's explanations are clear and concise. The practical examples provided throughout the course make it easy for viewers to apply the concepts learned in the course to real-world scenarios. The course is highly recommended for anyone who wants to improve their data analysis skills using Excel 2013.